

Table 1 summarizes the total number of invitations, lung health checks, baseline LDCTs and lung cancers diagnosed for both the whole program and initial phase. Whole-program data represent total activity in the program until March 2025 with over 4.5 times the number of LDCT and lung cancer diagnoses than the initial phase data.
Whole-program lung screening performance metrics
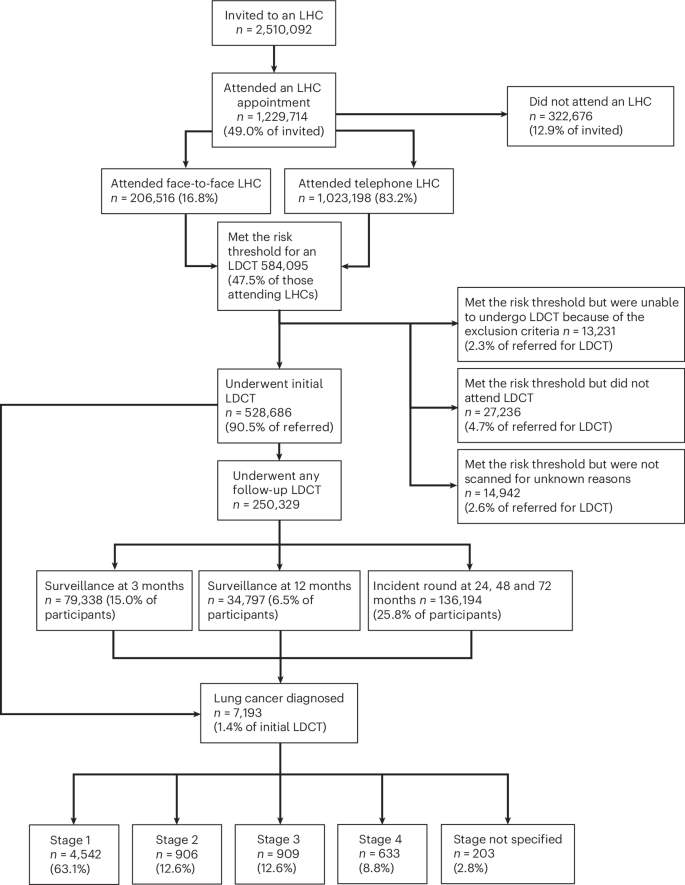
In the whole-program data from April 2019 to March 2025, 2,510,092 participants had been invited for a baseline Lung Health Check (LHC) across all Cancer Alliances (Fig. 1, consort diagram). This amounts to an invitation (coverage) of 32.4% of the total estimated, potentially eligible population of people who have ever smoked, aged 55–74 (7,743,437). Of those invited, 49.0% (1,229,714) have undergone an LHC (uptake of offer), and of these 16.8% (206,516 of 1,229,714) were performed face to face, and 83.2% (1,023,198) were performed by telephone, followed by face-to-face confirmation for those participants who qualified for LDCT screening; 47.5% (584,095) of participants met the multivariable model risk threshold (Liverpool Lung Projectv2 (LLPv2) or Prostate Lung Colorectal Ovarym2012 (PLCOm2012) models) and 43.0% (528,686 of 1,229,714 LHCs) underwent a baseline LDCT, while 4.7% (27,236 of 584,095 who met the LHC risk threshold and qualified for LDCT) did not attend or canceled their LDCT and 2.3% (13,231 of 584,095) met the risk threshold but were ineligible for LDCT on the basis of the exclusion criteria. A total of 2.6% (14,942 of 584,095) had no record of having had a scan, with reason unknown. A total of 79,338 three-month surveillance scans were performed, 34,797 twelve-month scans and there were 136,194 scans undertaken at 24, 48 and 72 months. The latter includes participants in whom incident round scans would not have been performed by the time of data extraction, that is a participant may have had a baseline scan but not yet have reached the point of having a 24-month scan. Therefore, the number of surveillance and incident round scans may be underrepresented. Extended Data Figs. 1 and 2 summarize the program geography and proportional national rollout as a marker of coverage, according to Cancer Alliance. Figure 2a shows monthly (noncumulative) numbers of invites, LHCs completed and LDCT performed. Early efforts to initiate the program that were hindered by COVID-19 restrictions are notable until Spring 202113.
Whole-program data to March 2025.

a, Lung cancer screening delivery trajectories. The number of first invites (people invited), LHCs and scans (across every scanning round) per month for the whole program, from May 2019 to March 2025, are shown. b, National lung cancer early diagnosis rates. Early diagnosis rates (% diagnosed at tumour node metastasis (TMN) stages 1 and 2), as a proportion of all lung cancer diagnoses, have increased for all deprivation quintiles after the pandemic, with the biggest change in stage (low to high rate) seen among those living in the most deprived areas. Source: NHS England Analysis of Rapid Registration Data.
By March 2025, 7,193 lung cancers had been diagnosed (1.4% of baseline LDCT participants), 2,228 in the last year. The stage distribution was 63.1% stage 1, 12.6%, 12.6% and 8.8 % stage 2, 3 and 4, respectively, with 2.8% stage not specified (Fig. 1). National Cancer Registration Data (NCRD) show that lung cancer early stage detection rates across the UK have increased steadily since the pandemic and are now well above pre-pandemic levels. Furthermore, since the lung screening program started, the proportion of stages 1 and 2 lung cancers in the most deprived socioeconomic quintile has increased from the lowest to the highest quintile (Fig. 2b). This has not been reported in other cancers.
Initial-phase participant record-level demographic analysis
Of 582,700 people in the initial phase who were eligible for an LHC, 216,985 (37.2%) attended. The proportion of different groups of the eligible population, participation rates, LDCT attendance and cancer diagnoses are presented in Extended Data Table 1 , while the odds ratios (ORs) are presented in Fig. 3; 303,825 of 582,700 (52%) of the eligible population were male, and 275,335 of 582,700 (48%) were female. LHC uptake in men and women as a proportion of the eligible male and female populations, respectively, were equivalent (113,670 of 303,825 (37.4%) versus 103,310 of 275,335 (37.5%)), but fewer women underwent an LDCT scan as a proportion of those attending an LHC (48.4% females versus 56.7% males). Specifically, of those assessed as high risk, women were also less likely to attend an LDCT than men (OR = 0.87, P < 0.001).
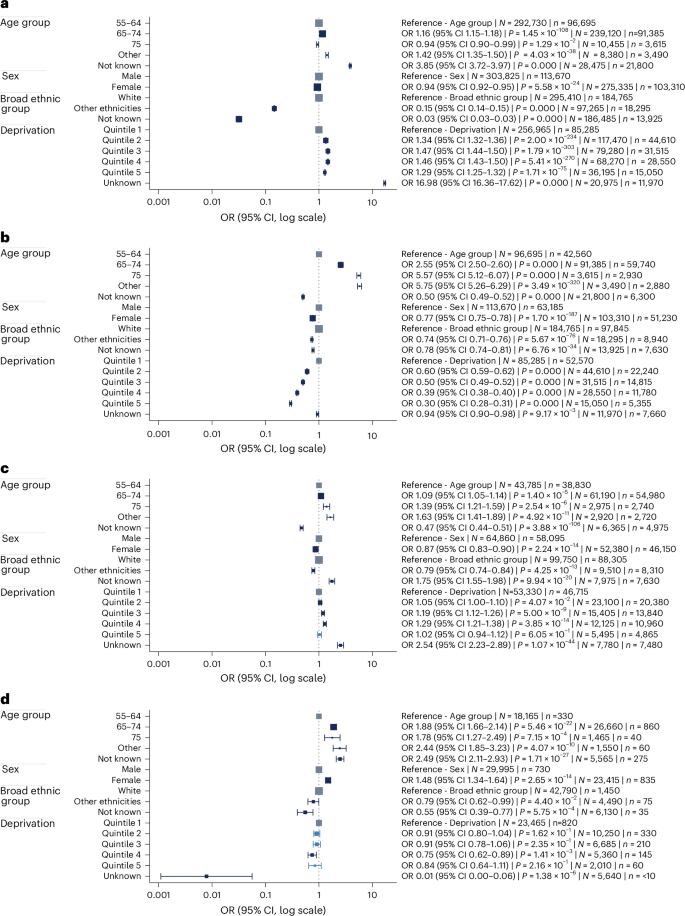
OR plots of initial-phase data assessing the associations between demographic characteristics. a, LHC attendance, of those in the eligible population. b, Participants assessed as high risk. c, LDCT attendance of those attending an LHC and high risk. d, Lung cancers detected of those who attended LDCT with ≥185-day follow-up. ORs represent point estimates and the accompanying error bars show the 95% confidence interval (CI). The size of each square is proportional to N, meaning that larger squares correspond to a greater number of individuals included at the start of the regression. Estimates were obtained using multivariable logistic regression. P values were calculated using two-sided Wald tests based on the standard normal distribution, with no adjustment for multiple comparisons. N refers to the total number of individuals included at the start of the regression (for example, people in the eligible population) and n refers to the number who experienced the outcome of interest (for example, those who attended an LHC). Counts were rounded to the nearest multiple of five and values below ten were suppressed to protect confidentiality.
Among those assessed as high risk, older individuals were more likely to undergo LDCT compared to the reference group aged 55–64 years (65–74 years, OR = 1.09, P < 0.001; 75+ years, OR = 1.39, P < 0.001).
Ethnicity data were not known for 32.6% of the 582,700 individuals eligible for an LHC because of incomplete primary care records. The further a participant progressed through the pathway, the more likely ethnicity status would be recorded. A smaller proportion of participants invited for an LHC in the ‘other’ ethnic group attended than those of the ‘white’ ethnic group (18,295 of 97,265, 18.8% versus 184,765 of 295,410, 62.5%; OR = 0.15, 95% CI = 0.14-0.15, P < 0.001). In the subset of people assessed as high risk at LHC, those from ethnic groups other than white were significantly less likely to attend LDCT compared to those from the white group (OR = 0.79, P < 0.001).
People in areas of least deprivation (quintile 5) had a higher LHC uptake than the most deprived (quintile 1) (15,050 of 36,195, 41.6% versus 85,285 of 256,965, 33.2%, OR = 1.29, 95% CI = 1.25–1.32, P < 0.001). However, 37.6% (5,665 of 15,050) of LHC participants from the least deprived areas underwent LDCT scanning versus 57.2% (48,760 of 85,285) people from quintile 1. After a high-risk assessment, those living in the most deprived quintile (quintile 1) were less likely to attend LDCT than those in quintiles 2 (OR = 1.05, P < 0.05), 3 (OR = 1.19, P < 0.001) and 4 (OR = 1.29, P < 0.001), but not significantly different to quintile 5 (OR = 1.02, P = 0.6).
Lung cancer detection in the initial phase
By January 2023, 74,202 participants had undertaken a baseline LDCT (Table 2). Three-month and 12-month nodule surveillance LDCTs were completed in 9,995 (13.5%) and 6,689 (9.0%), respectively. Three-month and 12-month scan data are not mutually exclusive (nodule assessment often requires both time points) and scans were censored at March 2024. Cancers (censored at August 2023) diagnosed from the baseline, 3-month and 12-month time point scans were 890, 135 and 70 (74.4%, 11.3% 5.9%) of 1,196 cancers diagnosed in the initial-phase data at all time points. This equates to a cumulative cancer conversion rate of 1.2%, 1.4%, and 1.5%, respectively of 74,202 participants. Twenty-four-month scans (most would represent incident round scans, and a minority of nodule surveillance scans) were documented in 24,933 participants of whom 36 were diagnosed with cancer (3.0% of 1,196 screen-detected cancers across both rounds); 2,393 scans at ‘other’ (undefined) time points detected 65 cancers. The total cancer detection proportion was 1.6% across both rounds.
Initial-phase data restricted to a follow-up period of at least 185 days from LDCT were available for 53,430 people; 2.9% (1,565 of 53,430) of participants had a lung cancer diagnosis in the Cancer Outcomes and Services Data (COSD)-linked data within 185 days of LDCT. Cancer outcomes were censored in August 2023, representing 185 days after LDCT (including those for nodule surveillance). The objective of this was to ensure that all cancer diagnoses resulted from the LDCT. This time was chosen after an analysis confirming that this did not include cancers diagnosed that were not related to the program. This approach was only for the initial-phase data. In this subset, cancers diagnosed were significantly higher in women than men (835 of 23,415, 3.6% in women, 730 of 29,995, 2.4% in men; OR = 1.48, 95% CI = 1.34–1.64, P < 0.001). Older (for example, 65–74 years) participants were also more likely to have a cancer diagnosis than younger (55–64 years) participants (OR = 1.88 CI = 1.66–2.14, P < 0.001) (Fig. 3 and Extended Data Table 1).
Incidental findings
Assessment of non-lung-cancer LDCT scan findings was made in 114,430 participants selected from the initial phase who underwent baseline LDCT scanning (Table 3); 54,695 (47.8%) had documented coronary artery calcification (severity grading was not collected), 36,745 (32.1%) had aortic valve calcification and 13,830 (12.1%) had emphysema (radiologically moderate or severe). Of note, 525 (0.46%) other (non-lung) cancers were diagnosed.
link


