


Inclusion criteria
-
Patient aging ≥ 18 years at the of data collection
-
Patients with confirmed diagnosis of diabetic kidney disease
-
Patients who had a follow up for at least 3 months by the time of data collection
Exclusion criteria
Sample size determination
The sample size for this study is calculated using a single population proportion formula. Assuming the proportion of patients utilizing of ACE inhibitors to be 50% as there is no any previous study done in a similar setting and with the intention of maximizing the sample size: (Table 1)
$$n=\fracz^2p(1-p)e^2$$
n = the required sample size, p = the proportion of patients utilizing of ACE inhibitors = 0.5, Zα\2 = the critical value at 95% confidence level = 1.96, e = precision (margin of error) = 5%
Accordingly,
$$n=\frac(1.96)^2*0.5(1-0.5)0.05^2$$
$$n=\frac(1.96)^2*0.5(0.5)0.05^2$$
Hence, by adding 10% for contingency due to incomplete and lost records to the highest calculated sample size (that is, 384), the total sample size required for this study becomes 422 patients.
Sampling procedures
Currently, there are thirteen public hospitals in Addis Ababa during the study period, with six having clinical care outlet dedicated for patients with diabetes mellitus as well as DKD. Out of these six hospitals, two (33.3%) were selected randomly via a lottery method. There were about 610 adult patients with chronic kidney diseases on follow up in the renal referral clinic of TASH while the corresponding number of patients at YHMC was 446, with varying follow up periods. (Fig. 1). Among the DKD patients at each study hospital, 390 and 196 are diagnosed to have chronic kidney diseases attributable to diabetes mellitus at TASH and YHMC, respectively. The sampling frame included all adult patients with DKD having clinical appointment during the specified study period as documented the appointment register at each study facility. Therefore, simple random sampling technique was employed at each study site to recruit sample patients proportional to their respective number of patients.

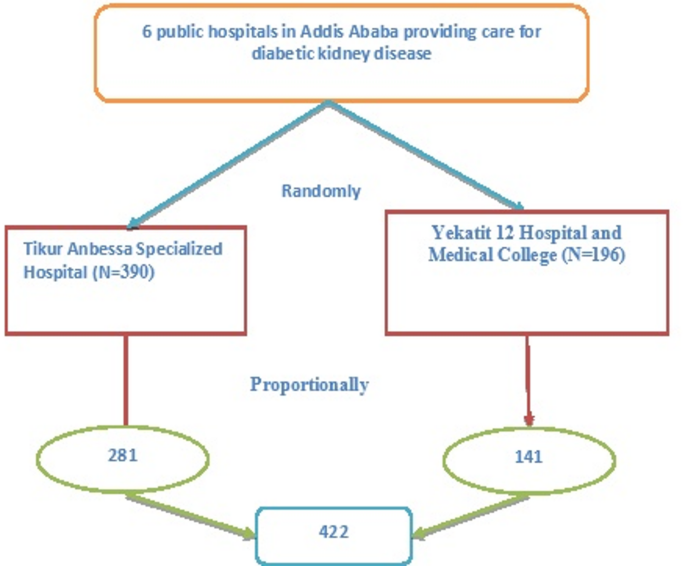
Schematic representation of sampling procedure in selected hospitals, Addis Ababa, Ethiopia, 2023.
Study variables
The dependent variable in the study is the optimization of antiproteinuric medications, categorized as either optimal or suboptimal doses. The independent variables include age group, sex, place of residence, current marital status, educational status, occupational category, use of CBHI, alcohol consumption, cigarette smoking, duration since diagnosis, body mass index, history of hypertension, history of IHD, type of diabetes mellitus, type of anti-diabetic medication, history of retinopathy, history of neuropathy, estimated GFR, glycated hemoglobin level, serum potassium level, and magnitude of albuminuria.
Operational definitions
Diabetic kidney disease: is defined as a persistent reduction in kidney function, usually with an estimated GFR (eGFR) below 60 ml/min per 1.73 m2 for more than 3 months, and kidney damage, usually by estimation of albuminuria > 30 mg/g creatinine in patients with diabetes1,2.
Utilization; DKD Patient who use one of anti-proteinuria medications.
Optimal Utilization: cases in which KDIGO 2022 recommended anti-proteinuria medications (ACEI/ARBs) are prescribed as per the guideline1,2.
Sub-optimization: cases in which KDIGO 2022 recommended anti-proteinuria medications are not utilized as recommended1,2.
Optimization: Assessed based on a binary outcome (Yes/No) to determine whether the utilization of antiproteinuric medications aligns with KDIGO 2022 recommendations.
Data collection tools and procedures
We used standardized data abstraction tool prepared thorough review of relevant literatures and related studies. Data were collected from eligible patients’ electronic medical records using a structured checklist. The data collection format includes items divided into three parts (background information, clinical variables, and laboratory parameters) and it was adapted from related literatures18. Data were gathered from logbook records of renal patient registry over three months (from November 1st 2023 to January 30th, 2023). Additionally, patients were contacted virtually through registered address or physically during follow up visits whenever pertinent patients’ details were needed. Two professional healthcare workers were recruited and trained on data collection procedure.
Data quality management
To ensure data quality, the tool was pretested before the actual data collection process in 5% of the total sample size among patients attending other hospital (Zewditu Memorial Hospital). An English version, pretested checklist was used to collect data. Brief training for the data collectors (two health professionals) about the process of data collection was given before the process of data collection. The data collection procedure was closely supervised, and each day, filled questionnaires were double-checked manually for consistency and completeness by data collectors and principal investigator before proceeding to analysis. To minimize errors, we implemented double data entry, followed by cross-validation to identify discrepancies. Data cleaning procedures were performed before analysis, including range and consistency checks.
Data processing and analysis
Data entering, coding, and cleaning were performed using Microsoft Excel spreadsheet (version 2016) and then exported to SPSS version 26 to carry out statistical analysis. Frequency and cross tabulation were used to check for missed values and variables. The demographic and clinical characteristics of patients were computed by using descriptive statistics such as mean, median, percentage, frequencies, interquartile range and standard deviation. Logistic regression analysis was used to determine associations between the independent and dependent variables. Those variables with p value of ≤ 0.25 in bivariable logistic regression were included in the multivariable logistic regression model to compute adjusted odds ratio at 95% confidence interval. Our rationale was to adopt an inclusive strategy during the variable selection stage to reduce the risk of omitting relevant predictors that might gain statistical or clinical significance when adjusted for other covariates. This method has been supported in the literature as a pragmatic balance between statistical rigor and the need to identify meaningful associations in observational research. In our multivariable logistic regression analysis, we employed the backward stepwise selection method. This approach was chosen to identify the most parsimonious model by sequentially removing variables that did not contribute significantly, while retaining those with meaningful associations after adjustment. Hosmer–Lemeshow goodness-of-fit test was run to ascertain the fitness of the model, where p value of > 0.05 indicates data fitness. Variables with p-value ≤ 0.05 were deemed statistically associated with the outcome variable. Finally, the study findings were presented using diagrams, tables and figures. We employed a complete case analysis approach, including only records with no missing values for the variables used in the final analysis. Cases with incomplete data were excluded from the regression analysis to maintain internal consistency. We have calculated VIFs for all variables included in the multivariable regression model. Any variables with a VIF greater than 5 were reviewed for potential multicollinearity.
link