


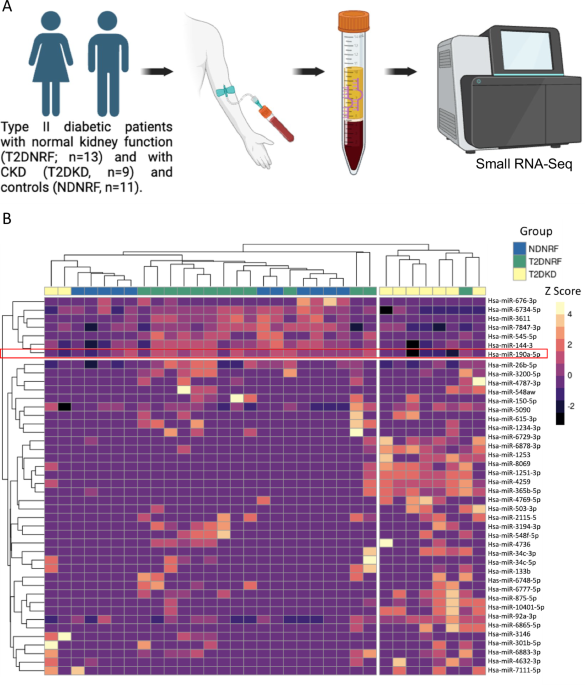
Study populations
For biomarker discovery using small RNA-sequencing, participants were recruited and gave written consent from kidney and cardiovascular clinics at the Belfast City and Royal Victoria Hospitals, Belfast. At the time of the study visit, the presence of CKD was determined on the basis of ≥ 2 eGFR measurements < 60 ml/min/1.73 m2 > 3 months apart or persistent albuminuria expressed as albumin-to-creatinine ratio (ACR) ≥ 3 mg/mmol in line with the clinical definition of CKD6. T2DM was diagnosed according to the American Diabetes Association 2010 criteria59. Patients with systemic metabolic disease other than T2DM, or those who had experienced infection within the previous month, were excluded from the study. In the discovery cohort (n = 33) patients were categorised into 3 groups: type 2 diabetes with kidney disease (n = 9) (T2DKD – T2DM and eGFR < 60 ml/min/1.73 m2, ACR in 3–30 mg/mmol range), type 2 diabetes and normal kidney function (n = 13) (T2DNRF – T2DM and eGFR > 60 ml/min/1.73 m2, ACR ≤ 3 mg/mmol) and no diabetes and normal kidney function (n = 11)(NDNRF).
To assess the utility of miR-190a-5p as a prognostic biomarker in patients with unselected CKD, we employed 549 patients from a prospective cohort study – ‘Non-invasive biomarkers of kidney disease’ (seNSOR), which recruited patients with unselected aetiology of CKD from outpatient clinics at the Royal Infirmary, Edinburgh, Scotland between March 2017 to March 2019. Participants with acute kidney injury (AKI) determined using the KDIGO creatinine-based criteria6 were excluded.
In both centres, research nurses obtained written consent and participant information was collected upon enrolment, including age, self-reported sex, ethnicity, diabetes status, blood pressure, aetiology of CKD and current prescribed medications. Baseline laboratory data obtained included: serum creatinine, albuminuria (as urinary albumin to creatinine ratio, uACR) and glycated haemoglobin A1c (HbA1c). Glomerular filtration rate was estimated from serum creatinine using the 2009 Chronic Kidney Disease Epidemiology Collaboration (CKD-EPI) equation, excluding race60. For the seNSOR cohort, kidney biopsy data and kidney outcome data were captured using the NHS Lothian patient record systems. The primary outcome of CKD progression was defined as reaching ESKD (starting renal replacement therapy (RRT) or maintaining an eGFR < 15 ml/min/1.73 m2 for > 90 days, or > 30% reduction in kidney function from eGFR at baseline maintained for > 90 days). Reaching ESKD alone was also used as a secondary outcome. Ethical approval was obtained from the respective Offices for Research Ethics Committees (Northern Ireland REC/14/NI/1132; Scotland REC/15/ES/0094). For the biopsy samples, tissue use was approved by the steering committee of the National Research Scotland Lothian Bioresource (REC 20/ES/0061, study SR2175).
Small RNA-sequencing (sRNA-Seq)
Whole blood was collected in an ethylenediaminetetraacetic acid (EDTA) collection tube, centrifuged at 3000 × g for 10 minutes at 4 °C, and the supernatant aliquoted in RNase/DNase-free tubes and frozen at − 80 °C. RNA was extracted from 600 μl of plasma using the NextPrep™ MagnaZol™ cfRNA Isolation Kit (Bio Scientific Corp, Texas, USA) and quantified using the Qubit miRNA Assay kit (Thermo Fisher Scientific, San Jose, USA).
microRNA libraries were prepared using QIAseq miRNA Library Kit (Qiagen, Hilden, Germany). Library concentrations were quantified using the Qubit dsDNA HS Assay Kit (Thermo Fisher Scientific), and quality control was performed using a High Sensitivity NGS Fragment Analysis Kit (Agilent Technologies, Santa Clara, CA, USA). Libraries were pooled at 4 nM molarity and sequenced using the NextSeq 500 High-Output Kit (Illumina, San Diego, CA, USA). Raw read quality control was performed with FastQC, adaptors trimmed with Trim Galore, reads collapsed with seqcluster and aligned with Bowtie1 against miRBase mature miRNA and miRBase hairpin (miRbase Ver 22, available at Post-alignment processing of miRBase hairpin was performed using SAMtools and EdgeR (3.36.0) for miRBase analysis. The FASTQ files and expression matrix are available in Gene Expression Omnibus (GEO) (GSE262414). This provided a count table of miRNA reads ready for downstream analysis in RStudio (Ver 4.1.1). As previously performed37, exploratory principal component analysis was first performed using DESeq2 (Version 1.34.0). After count normalisation and removal of lowly expressed reads, differential expression analysis was performed using EdgeR (Version 3.36.0). A fold change > 1.5 and false discovery rate (FDR, Benjamini-Hochberg method) < 0.05 was considered significant.
RNA-Sequencing of bulk cortical tissue and fluorescence-activated cell sorting of specific kidney cell types
As previously described37,38, male 8–12-week-old C57BL/6 mice (Envigo) (n = 5/group) underwent laparotomy and unilateral ureteric obstruction (UUO) followed by ureteric reimplantation to reverse the obstruction for the rUUO group. Mice were culled at day 2 after UUO (UUO-2), at day 7 after UUO (UUO-7), and in the rUUO group at 14 days after reversal by exsanguination under terminal isoflurane anaesthesia. Immediately after culling, mice were perfused with 5 mL PBS. The kidneys were harvested, with the kidney capsule removed and placed in ice-cold PBS and processed as previously described37,38. RNA integrity was checked using Agilent Technologies picochips. All samples utilised for sRNA-Seq had a minimum RNA integrity score of 7. For the bulk and single-population sRNA-Seq, RNA underwent sRNA-Seq by Genewiz, using the Illumina HiSeq platform, generating paired-end reads of 50 bp (n = 4 per group)(sRNA-Seq dataset – GSE150035). For gene expression analysis of sorted cell populations, RNA integrity was ≥ 9 for all samples, amplified cDNA was prepared using Ovation® RNA-Seq System V2 (NuGEN) and sequenced by Genewiz on the Illumina HiSeq platform with 2x150bp configuration (n = 4 per group). Data from the gene expression from sorted cell populations is available at GEO (GSE262799).
Gene targets of miR-190a-5p were identified using the R package multiMiR (1.6.0). multiMiR allows the user to identify validated miRNAs from multiple databases. For predicted miR-gene interactions, we selected only interactions which were conserved and present in more than one database. We performed pairwise correlation of proximal tubular cell expression changes (GSE262799) of predicted miR-190a-5p gene targets. Genes negatively correlated to miR-190a-5p (correlation coefficient of < − 0.6) were considered potential gene targets. Finally, the pathways enriched for miR-190a-5p target genes were explored using the package ClusterProfiler (3.12.0).
Analysis of miR-190a-5p in seNSOR samples
Whole blood was collected into a BD Vacutainer® SST™ Tubes, centrifuged at 3000 × g for 10 min at 4 °C, and the supernatant was aliquoted in RNase/DNase-free tubes and frozen at -80 °C. Synthetic C.elegans miR-39 (Qiagen) was added as an exogenous reference miR prior to RNA extraction from 200 μl of serum using the miRNeasy serum/plasma kit (Qiagen). Reverse transcription was performed using the microRNA reverse transcription kit (Thermo Fisher Scientific) with specific primers for hsa-miR-190a-5p and cel-miR-39. Real-time quantitative PCR (RT-qPCR) was performed using specific primer:probes (Thermo Fisher Scientific) (Supplementary Table 1) with Universal Master Mix II (Thermo Fisher Scientific) on the QuantStudio 5 (Thermo Fisher Scientific). Cycle threshold was obtained for miR-190a-5p and normalised to cel-miR-39, and relative miRNA expression calculated using the 2-ΔCT method and relative standard error of the mean plotted.
For biopsy samples, a subset of seNSOR patient biopsies samples, frozen in optimal cutting temperature (OCT) compound, were obtained from the NHS Lothian Biobank (REC 20/ES/0061, studies SR2175) (n = 26). RNA was extracted and reverse transcription performed using the microRNA reverse transcription kit (Thermo Fisher Scientific) with specific primers for hsa-miR-190a-5p and control snoRNA RNU48 (Supplementary Table 1). RT-qPCR was performed using specific primer:probes (Thermo Fisher Scientific)(Supplementary Table 1) with Universal Master Mix II (Thermo Fisher Scientific) on the QuantStudio 5 (Thermo Fisher Scientific). Cycle threshold was obtained for miR-190a-5p and normalised to RNU48, and relative miRNA expression calculated using the 2-ΔCT method and relative standard error of the mean plotted.
Histological analysis of seNSOR biopsies
Immunofluorescence staining on 24 human kidney biopsy samples was performed using a BOND III automated immunostainer (Leica Biosystems). Pancytokeratin (PanCK, Merck, Cat C2562) at 1:6000 dilution, and CD10 (Leica, Cat: NCL-L-CD10-270) at 1:600 were added together, and the same Opal 520 fluorophore used for both, so together they represent pantubular epithelial markers. Images of whole slides were acquired using the Axio Scan Z1 whole slide scanner (Zeiss, Jena, Germany). Images were then analysed using QUPath (version 0.5.1) and areas of cortex manually annotated. Areas of positive staining for PanCK / CD10 were expressed as a percentage of the cortical tissue to calculate tubular mass percentage.
Cortical slides stained for Masson’s Trichrome were available for 25 biopsy samples from which miR-190a-5p expression had been determined. A single blinded operator performed semi-quantitative cortical interstitial fibrosis assessment on these slides.
Cell culture of kidney proximal tubular cells (RPTECs)
Human kidney proximal tubular epithelial cells (RPTEC/TERT1) (ATCC® CRL-4031TM LGC Limited, UK) were maintained in complete growth media consisting of DMEM/F-12 (2.5 mM L-glutamine, 15 mM HEPES, 0.5 mM sodium pyruvate, and 1200 mg L−1 sodium bicarbonate) (Gibco, New York, USA), geneticin 2 µL mL−1 (Gibco, New York, USA), hydrocortisone 25 ng mL−1 (Sigma Aldrich, Gillingham, UK), ascorbic acid 3 µg mL−1 (Sigma-Aldrich, Gillingham, UK), sodium selenite 6.7 ng mL−1 transferrin 5.5 µg mL−1, insulin 10 µg mL−1 (Gibco, New York, USA), triiodo-L-thyronine 6 pM (Sigma-Aldrich, UK), prostaglandin E1 25 ng mL−1 (Sigma-Aldrich, Gillingham, UK), rhEGF 10 ng mL−1 (Promega, Southampton, UK). Cells were grown at 37 °C, 5% CO2, in T75 cm2 flasks to 100% confluence. For passaging, cells were detached using trypsin, spun and resuspended in fresh media.
Manipulation of miR-190a-5p levels in RPTECs
Dharmacon miR-190a-5p miRNA mimic (C-300639-03-0002) and inhibitor (IH-300639-05-0002), along with negative control mimic (CN-001000-01-05) and miRNA hairpin inhibitor negative control (IN-001005-01-05) were purchased from Horizon Discovery. RPTECs were transfected with 100 nM of miR-190a-5p inhibitor or 5–50 nM miR-190a-5p mimic or controls using siPORT™ NeoFX™ Transfection agent in Opti-MEM for 6 h before adding complete media. Media was replaced after 24 h and cells left for a further 48 h prior to being collected in Qiazol.
RNA was extracted from cells using the miRNeasy mini kit (Qiagen) following the manufacturer’s instructions. cDNA was prepared using the reverse transcription kit with random hexamers (Thermo Fisher Scientific). RT-qPCR was performed using specific primer:probes for a disintegrin and metalloproteinase domain-containing protein 10 (ADAM10) and peptidylprolyl isomerase A (PPIA) was used as the reference gene (Supplementary Table 1). Reverse transcription was performed using the microRNA reverse transcription kit (Thermo Fisher Scientific) using specific primers for miR-190a-5p and snoRNA RNU48 (Supplementary Table 1) as an endogenous reference small RNA, and RT-qPCR performed using specific primer:probes (Thermo Fisher Scientific). All RT-qPCR was performed with Universal Master Mix II (Thermo Fisher Scientific) on the QuantStudio 5 (Thermo Fisher Scientific). Relative expression was calculated as a change in cycle threshold (ΔCT) for each sample to the housekeeper and plotted as 2-ΔCT, and the relative standard error of the mean plotted.
miR-190a-5p expression and manipulation in vivo
All procedures were approved by the Animal Welfare and Ethical Review Body (AWERB) at the University of Edinburgh and were conducted in accordance with the United Kingdom Animals Scientific Procedures Act 1986 and the ARRIVE guidelines under Project Licences approved by the UK Home Office. Our human data contained male and female biological sex, and the effects observed were independent of biological sex. Therefore, for our pre-clinical models, we used only male animals as these have been well characterised in-house and previous publications with robust data were available to perform power calculations to determine group size.
C57BL/6 J mice and SV129 mice were purchased from Enviago and housed in a pathogen-free environment at the University of Edinburgh. Mice were housed at 50% humidity and 22–26 °C with 12: 12 light: dark cycles starting at 07:00 local time. Mice were group-housed and given ad libitum access to water and standard chow (rat and mouse maintenance diet 1 (Special Diet Services)).
Subtotal nephrectomy was performed as previously described on SV129 mice36. Briefly, mice were randomly allocated to either receiving a sham (n = 5) or subtotal nephrectomy surgery (n = 8). Animals were recovered and left for 12 weeks to allow progressive kidney injury to occur. At 12 weeks animals were culled and tissue taken.
Unilateral IRI (uIRI) surgery was performed as previously described35,40. Briefly, a flank incision was made, and for sham surgery (n = 4), the left renal pedicle identified and touched with a moist cotton bud, for uIRI animals (n = 6), it was clipped using an atraumatic clamp for 18 min. During the ischemic period, body temperature was maintained at 37 °C using a heating blanket with homoeostatic control (Harvard Apparatus), measured by a rectal temperature probe. The clamp was then removed, the peritoneum closed with 5/0 suture, and the skin incision closed with clips. At 14 days post-surgery, a flank incision was made on the right side and a contralateral nephrectomy performed to produce a function model of IRI injury, and animals culled 7 days post-nephrectomy.
For the intervention study, mice (n = 7/gp) were assigned to either an experimental group receiving subcutaneous miR-190a-5p mimic (purchased from Horizon Discovery) injected at 0.625 μg per kg in PBS or scrambled control mimic (Horizon Discovery) using randomiser software and end analyses were conducted blind. Animals were dosed Day -1, 1, 3, 6, 8, 10, 13 and culled on day 14, without a contralateral nephrectomy.
For all in vivo studies, kidneys were divided and one portion snap frozen for RNA extraction, and the other portion stored in 10% formalin for histological analysis.
Histological analysis of mouse kidney tissue
Formalin fixed and paraffin embedded (FFPE) mouse kidney tissue was sectioned at 3 μM. Sections were deparaffinized twice for 5 min in xylene and rehydrated in sequential 100%, 90% and 70% ethanol for 2 min each and placed in distilled water. Picrosirius red (PSR) staining was performed using the Picrosirius Red Stain Kit (Abcam, ab150681) following manufacturer guidelines. After rehydration, tissue sections were incubated in PSR for 60 min. Slides were rinsed in acetic acid solution and dehydrated in absolute ethanol before mounting. Non-overlapping images of sections were obtained for each animal and analysed blinded by a single operator with Fiji ImageJ to determine the percentage of fibrosis.
Gene Expression analysis in mouse tissue
Total RNA was extracted from snap-frozen kidney tissue using the miRNeasy Mini kit (Qiagen), following the manufacturer’s instructions. cDNA for quantitative PCR was synthesised from the extracted RNA using the reverse transcription kit with random hexamers (Thermo Fisher Scientific). RT-qPCR was performed using TaqMan Universal Master Mix II (Applied Biosystems) and TaqMan Gene Expression Assay-specific primers (Supplementary Table 1) and normalised to Ppia expression.
Single-cell analyses
For correlation analysis of ADAM10 and TLN2 single nucleus multiome (paired gene expression and chromatin accessibility) data was downloaded from GEO in Seurat (v4.4.0) format (GSE254185)35. Due to sparsity and technical dropouts in single-cell transcriptomics data, we opted to assess the average expression levels in partitions of the nearest neighbour graph instead of individual cells for gene-to-gene correlations.
For this purpose, using the original cell annotations, the data was subset to proximal tubule (PT) cells and subclusters of the weighted shared nearest neighbour (wsnn) graph were constructed using the FindClusters function with resolution n = 8 (median: 131 cells/cluster). Clusters were subsequently pruned by discarding clusters with less than 20 cells. The average log-scale expression level of ADAM10 and TLN2 was derived using the AverageExpression function, and cluster-level average expression was used for visualisation as a scatterplot.
Statistical analyses
The normality of distribution for all key variables was assessed by the Shapiro-Wilk test. Clinical characteristics for continuous data are expressed as mean ± standard deviation for normally distributed data and median (interquartile range) when not normally distributed. Categorical variables were expressed as counts (percentages). For continuous values with normal distribution, t-tests or ANOVA were used to compare 2 groups or > 2 groups, respectively. For continuous values without normal distribution, the Mann-Whitney test was used to compare 2 groups and a Kruskal-Wallis test was employed if > 2 groups. Categorical values were assessed using a Chi-square test. For the determination of linear correlation between variables, correlation coefficients (r) were estimated using Spearman’s rank tests (if the data was not normally distributed) or Pearson’s (if the data was normally distributed). Kaplan-Meier survival curves were constructed for the primary kidney endpoints comparing above and below median miR-190a-5p separately for each uACR stage ( < 3 mg/mmol, 3–300 mg/mmol, > 300 mg/mmol), with the log-rank test used to compare curves. Cox univariate and multivariate proportional hazards survival models were performed to assess factors that predicted the endpoints, for multivariate analysis we excluded those patients with no ACR available. Circulating miR-190a-5p expression was log-transformed before entering the model due to non-normal distribution. For in vitro miR-190 mimic and inhibitor experiments, biological repeats were used (n = 3), with 3 technical replicates per sample and results analysed by Student’s unpaired t test. All tests were performed using SPSS version 28.0 (IBM, Armonk, NY), R version 4.1.2 (R Foundation for Statistical Computing, Vienna, Austria) or Graphpad Prism version 10.1.2 (Graphpad software, Boston, Massachusetts). A p-value < 0.05 was considered significant.
link